Visme simplifies the process of creating and sharing compelling presentations, infographics, graphical reports, as well as other visual formats. Visme is a content creation platform used by IBM, General Dynamics, and Accenture, and also 4.5 million other users.
It helps to express and convey the user’s experiences and turn dull facts into compelling Visuals. Interact as an individual or as a group. Post online, incorporate on your website, or save to your computer for offline use.
Moreover, visme can also be used to generate designs for infographics, charts, logos, and concept art. It is a comprehensive tool to generate visuals for social media postings and the web, letterheads, and other objects.
This appreciable tool also allows you to save color palettes, photographs, videos, and other documents for your company or brand. It’ll be simple to ensure that you are utilizing the most up-to-date branding this way.
Visme comes with a bunch of layouts and accessibility to a massive amount of stock photos. This way it offers great support for non-designers to use this tool and obtain great results. Visme is accessible as an online application as well as a desktop application for macOS and Windows.
Visme Company Details
Payman Taei is the founder of Visme, one of the popular image editing and graphic design platform.
Company Name: Easy WebContent, Inc.
CEO Name: Payman Taei
Est Year: 2013
Employees: 11-50
HQ Location: Maryland, US
Visme Demo & Media
Top Features of Visme
Visual representation of data
Templates for projects
Templates for documents
Offline mode
Statistics on customer activities
Drag and drop capabilities
Visual effects
Connectivity with Microsoft Office
Confidentiality and security
Charts and graphs
Pros of Visme
Easy to use platform with a variety of templates and tools
Can create professional looking visuals without any design experience
Perfect for creating infographics, presentations, and other types of visual content
Cons of Visme
Limited customization options compared to other design platforms
More expensive than some of its competitors
Not ideal for complex designs or projects that require a lot of
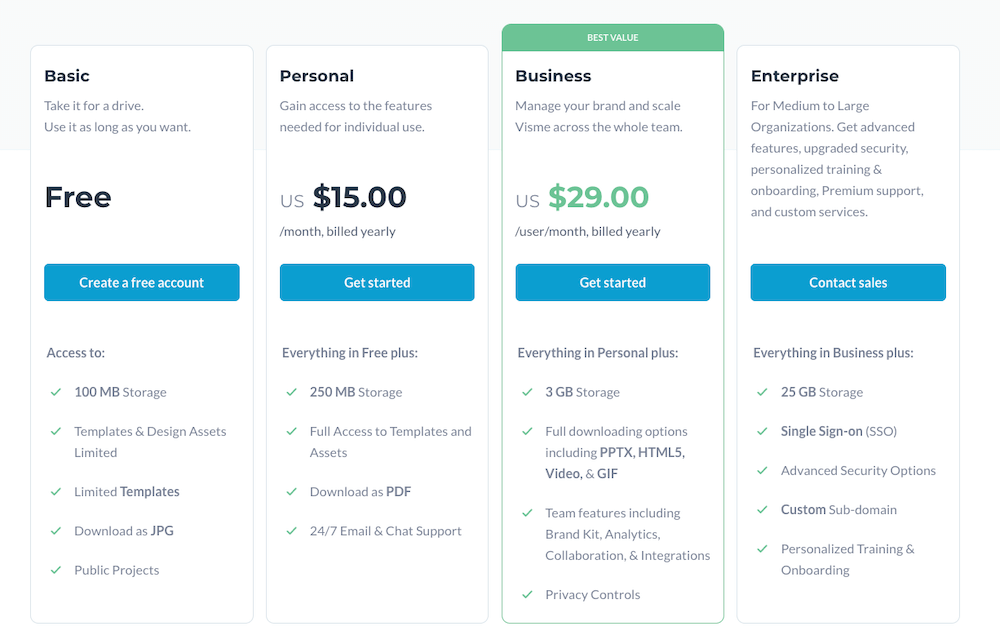
Visme Pricing
Basic
Free, but with restricted features.
Amount of Projects (3)
Storage space that is available (100 MB)
Online Publication
Projects to Download (JPG)
Widgets for Charts and Infographics (Limited)
Personal
$15 per month the majority of premium features.
Amount of Projects (15)
Storage space that is available (250 MB)
Online Publication
Projects to Download (JPG, PNG, PDF, HTML5)
Widgets for Charts and Infographics
On projects, there is no Visme brand
Business
$29 per month with all premium features.
Amount of Projects (Unlimited)
Storage space that is available (Unlimited)
Publication through the internet or in private
Projects to Download (JPG, PNG, PDF, HTML5)
Widgets for Charts and Infographics
On projects, there is no Visme logo
BrandKit
Download and save as a Powerpoint presentation
Collaboration and Participation
Videos, audios, and animations are all available
Visme Review Competitor Price Comparison
Find the most cost-effective solution for your business. Check the price comparison of all the software that we listed in this category.
Visme is a visual content platform that allows anybody, even non-designers, to quickly produce stunning presentations, infographics, reports, and social media photos.
Yes! Visme is free, and there is no time limit on how long you may use it. Approximately 80% of all functionality is available for free, with only a few essential capabilities available to our Premium members.
PowerPoint can help you create a compelling tale in your presentations while also making it simple to publish your slides online. Whereas, Visme revolutionizes how you produce and distribute compelling PowerPoint presentations, infographics, and other visual formats.
Visme is simple to use, even for those with no prior graphic design or technological knowledge. Visme is a useful presentation tool that is simple to use, allows for stunning designs, and has the ability to amaze audiences.
Visme is a web-based data visualization application that assists people and teams in transforming data into compelling presentations and infographics.
Platforms Supported
Windows: Supported
MacOS: Supported
Web-Based, Cloud: Supported
iPhone / iPad: Supported
Android: Supported
Review Method
At NitDit, we go through each product in detail so that we can prove the most authentic information to our audience. We try the products, go through documentation, do research in user sentiments before adding our final recommendation.
We go through the software in detail
We test most of the software before writing
We go through documentation
We check communities for user sentiment
Affiliate Disclosure: NitDit is reader-supported. When you buy through links on our site, we may earn an affiliate commission.