The Infographic tools mentioned in this collection will help you to create a stunning visual presentation for your brand and make sure that you can grow your brand like a pro.
Sometimes even though you take all the pain to craft your best content for your readers, you may be surprised to find out that you still have to struggle to get a good readership. This might leave you wondering for a reason.
But do you believe that the problem is with your writing?
Well, unless you are extremely bad with grammar and have really bad English that becomes difficult to get across the table, I do not believe a content writer can be that bad. If that might be the case, you would surely not try to write and attract readers.
So what is the problem? Did you consider the point of the fact that people might not want to read the post because they might not have enough time or the desire to read through it?
What do you do in such cases? A great way to indulge your readers into reading what you have written is by creating infographics.
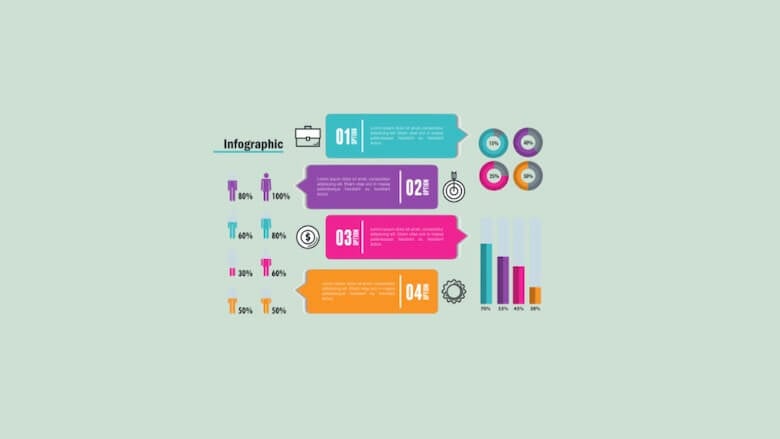
Infographics are a visual representation of content that can turn any dull, and complicated content into something more interesting and inspire your readers.
By creating an infographic, you give a gist of your entire content with the help of interesting elements and content that will instantly catch your reader’s attention.
Also, you can drive tons of traffic from Pinterest where the Infographic works perfectly.
In this post, I will tell you about some amazing tools that will make creating infographics a lot easier for you.
But before we move on to that section, let’s look into some other factors that are making infographics a seemingly important part of marketing.
Why Do You Need Infographics?
There are many reasons why infographics are a must for your business in today’s competitive market.
If you want to position yourself as an expert, then start investing your time in creating some infographics. Here are some factors on how infographics will help you boost your business.
Having said that let us now look at some tools that will help you create stunning infographics for you in no time at all.
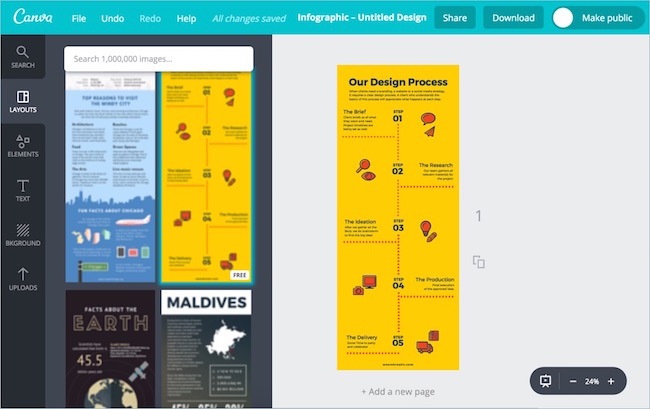
01. Canva
Canva has always been my favorite tool, no matter what aspect of designing you want to use it. Take my word. This brilliant tool is something that will never disappoint you at all.
With Canva, you can create your infographics like a pro. It is an online image-creating tool that helps you craft amazing infographics for your business.
It comes with hundreds of fantastic templates that you can pick according to your business needs.
This might include a pre-built template for your Twitter header, social media, a presentation, and a lot more. It even offers stunning pre-built templates for infographics as well.
The best part is that it is not mandatory for you to go with the pre-built color, font, and elements that it comes with.
Every single part of these templates is editable. So you can choose your colors, fonts, elements, images, and whatever else you want to include in your design.
This tool is free to use, but you can also upgrade it to the paid version to make use of its paid elements.
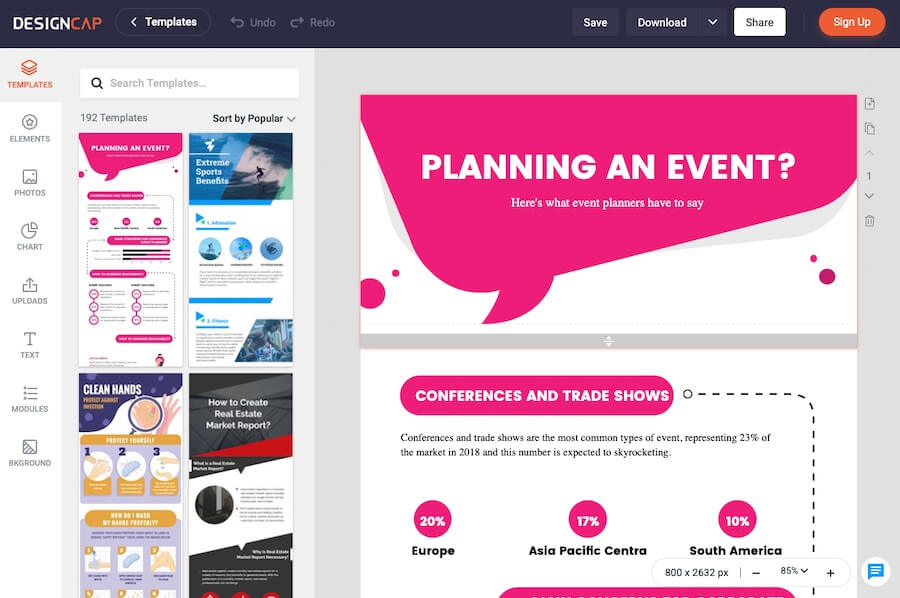
02. DesignCap
With thousands of ready-to-use design templates, the DesignCap is one of the leading resources for creative designers.
You can use this tool to create any kind of design, be it an Instagram post or an infographic.
Here are all possible design options with DesignCap.
- Infographic
- Poster designs
- Flyer design
- Logo design
- Business card
- Brochure
- Instagram posts
- Facebook ad
- Facebook Cover
- Ad banners
- Menu design (Restaurant & others)
- Presentation
- Report
- YouTube designs
- Twitter header
- Pinterest graphic
- And more
So, it covers almost everything that you may need for day-to-day use.
DesignCap comes with a very easy-to-use user interface, so you don’t have to be a creative designer to make the best use of this tool.
Here is what the user interface looks like. Just select the creative type that you wish to work on and start designing your graphic.
Once you are inside the editor, you may start from scratch and create your own custom design by using the elements available in the tool, or you can select a demo template from the available options and work on that.
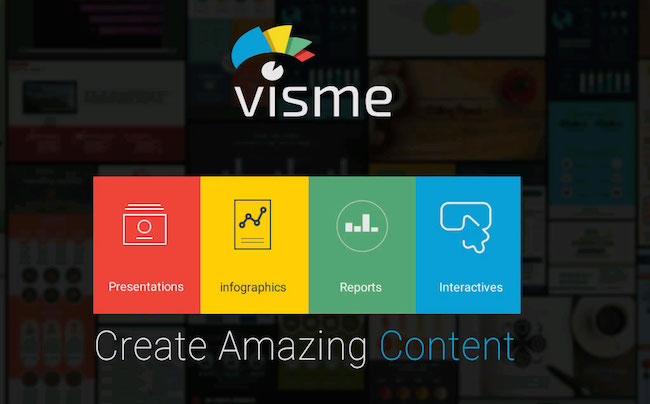
03. Visme
With Visme you have everything that you need to talk to your readers with a visual edge. This brilliant tool comes with amazing features that will help you create an infographic in no time at all.
Although this tool is also into creating presentations, it is more inclined towards creating amazing infographics.
Visme comes with countless fonts, images, icons, and a lot more. It even gives you the option to add a video to your design. Isn’t that cool? And guess what. You can also record your voice directly in the editor.
Besides you can even animate things to simplify your content for your readers. Like Canva, this tool is also absolutely free. So without paying a single penny get set to rock your infographic designs.
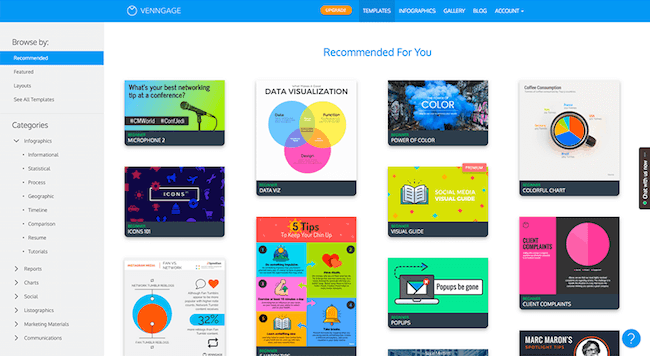
04. Venngage
The next tool on our list is another brilliant tool that will make you feel like an expert designer. Venngage is a free tool that comes with different eye-catching designs to help you create something fancy and engaging.
Be it a simple poster, a promotion banner, a report or a nice-looking infographic packed with information, Venngage is the right tool that you need for your business.
It makes designing so easy and quick that you will not be able to forget it every time you are up to designing something.
Even with all its prebuilt designs, you will find many other elements that you can directly pick and add to your design.
Overall it’s a fancy tool that you will always love using. With this, you can come up with all your designs in less than 30 minutes’ time.
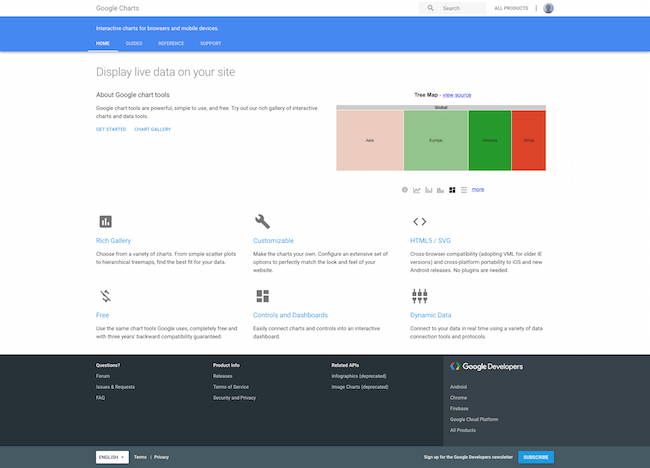
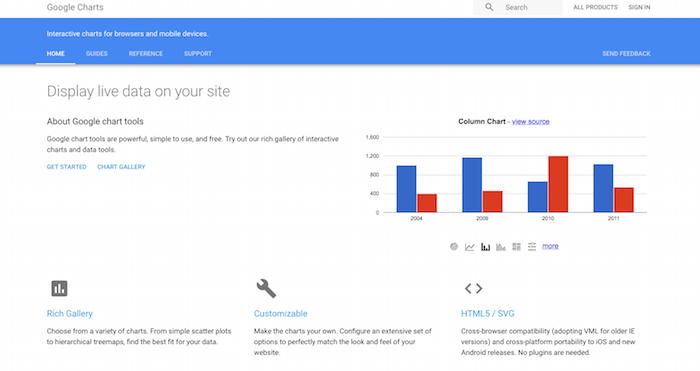
05. Google Charts
Bring out the infographic to perfectly match your sites’ look and feel with this brilliant tool. This is a perfect tool for anyone who is into creating a lot of charts for their business.
You can use various chart designs to make your design look great and fancy. You can even connect your data in real-time and make Google Charts the perfect infographic generator for your website.
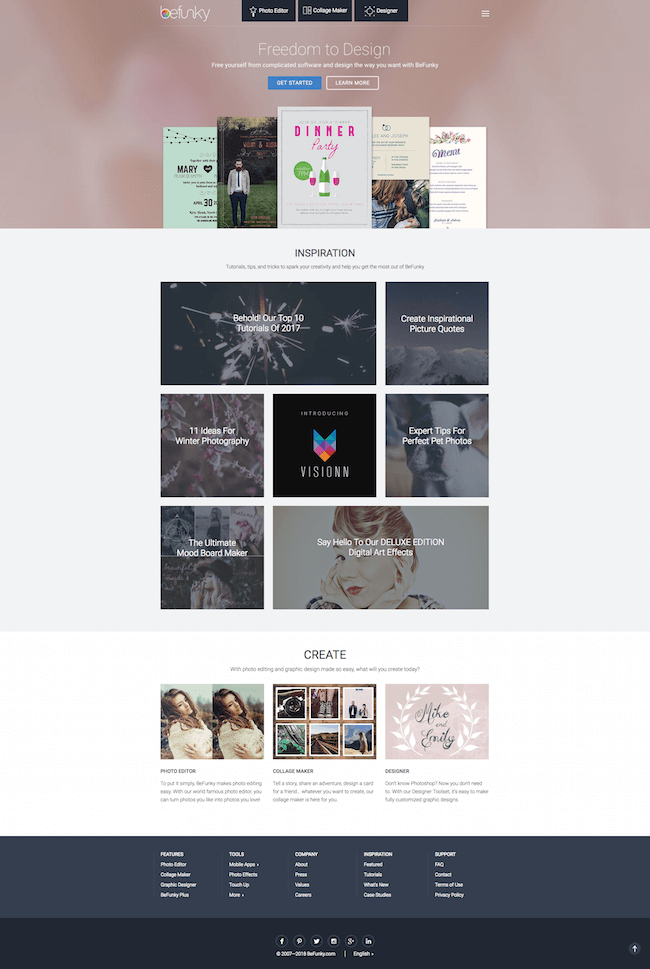
06. BeFunky
BeFunky is a user-friendly tool that helps you create striking designs with all its templates and design elements.
You can easily select a template, customize your theme with images and icons, and then beautifully personalize the infographic by adjusting the text, colors, and layout.
Once you are satisfied with your design, you can simply save and export it for your users. You can use the basic elements of this tool for free. But if you want to be an advanced user, you will have to upgrade to its free version.
07. Animaker
This tool is slightly different from all the others mentioned in this post. This tool is dedicated to designing motion infographics for your business. So why not bring in some more entertainment to your site by creating a few motion infographics for the website?
This tool comes with tons of features to make your design cool and striking. You can make up to 5 two minute videos for free with this tool every month.
Now that sounds interesting. Doesn’t it?

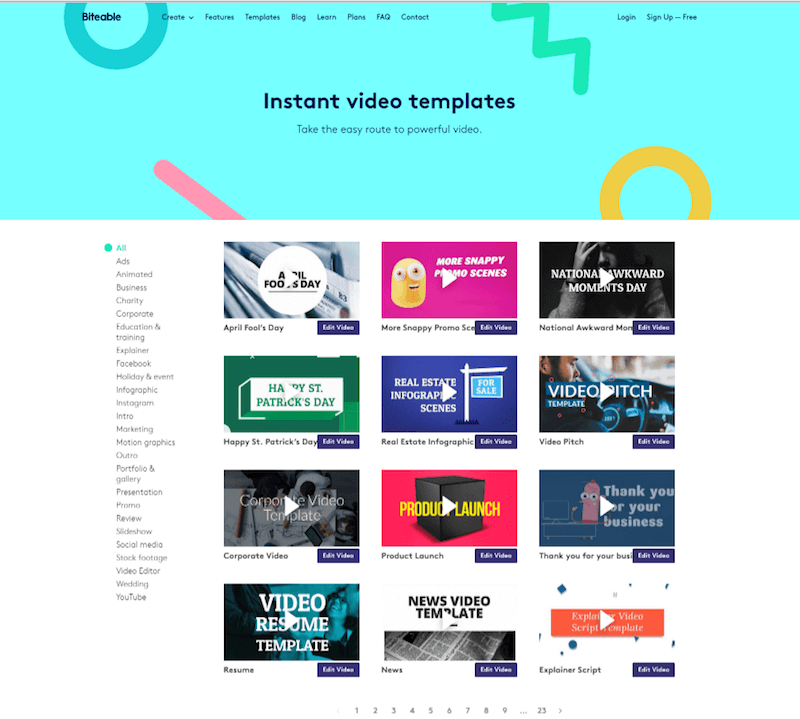
08. Biteable
Infographics and videos, both are very powerful marketing tools that can have a great positive impact on your business.
Why not combine them both and share them on social media to drive tons of traffic back to your site.
Biteable is a tool that offers you a quick and simple option to create stunning modern infographic videos that can go viral in your niche.
The tool offers you all the required options, great images, and ready templates to create your infographic videos.
And the best part is that you can use the tool for free and create your videos.
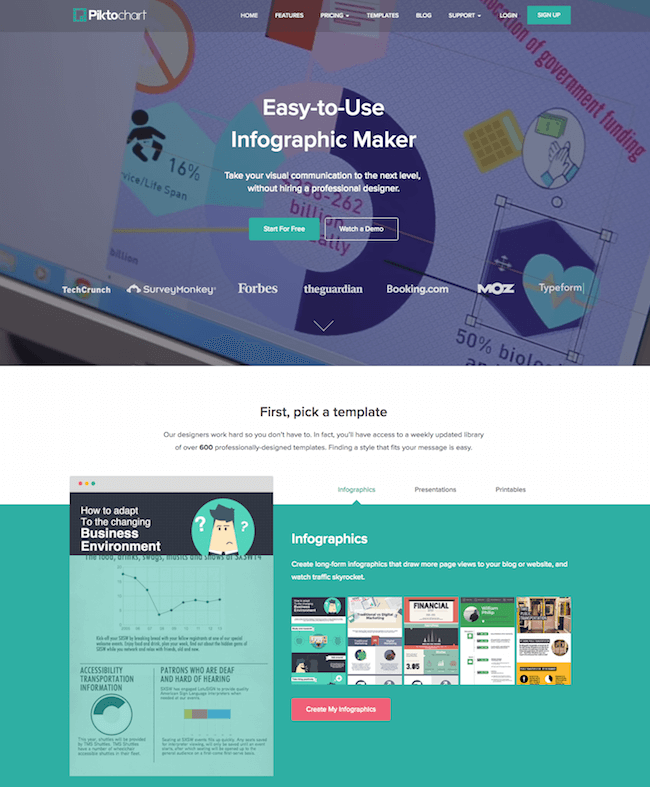
09. Picktochart
Here is another smart tool to create mind-blowing infographics. You can pick different sizes and formats for your design and build the design that you always wanted to create.
With this tool, you can either pick a pre-built design and start using it directly just by replacing your content or create a whole new design by starting from scratch.
Just get started by selecting a nice design and then start adding all the elements you want to be in your design. Finish it by adding your content and giving it a final touch of perfection by synchronizing the color, font, and images.
And that’s it. Your design is ready to go.
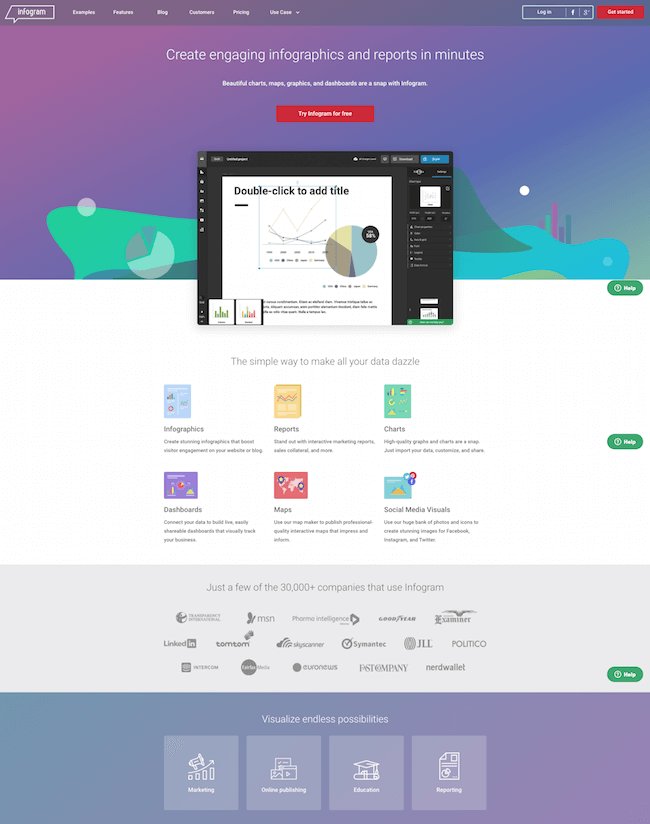
10. Infogram
This is another amazing infographic creation tool that deserves to be on this list. It comes with tons of amazing features to make your designing experience easy and effective for your business.
This tool lets you add graphics, charts, maps, and even upload pictures and videos to your design. You can add your content and style it as per your business requirements.
This tool is also free for basic users. You can upgrade it and become an advanced user by paying just an amount of $19/month.
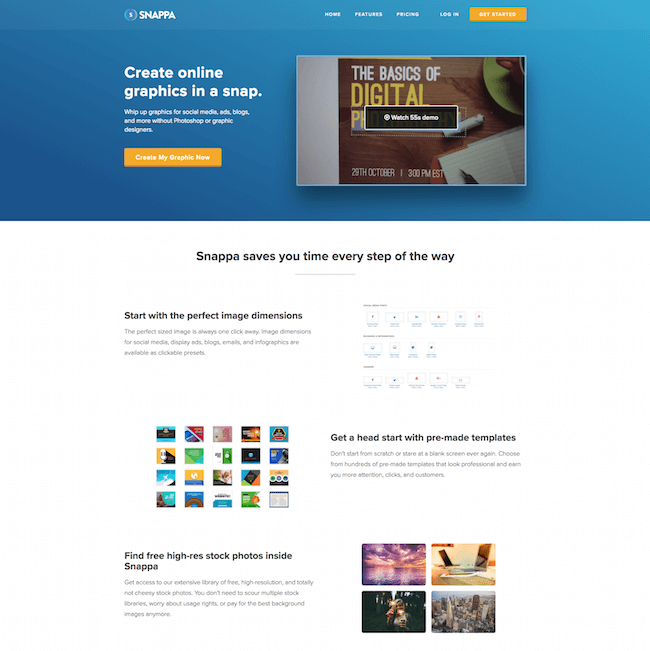
11. Snappa
Snappa comes with a free infographics maker that is stuffed with tons of amazing designs. This tool is created especially for people who do not have any design knowledge.
With Snappa, you can craft an extremely captivating design in less than 10 minutes.
Its simple drag-and-drop interface makes working with it a lot easier. You can also avail of its stock of free images to make your design stand out in the crowd.
You can start using this tool for free as a beginner and then upgrade it to pay $10/month if you think it is needed to boost your business.
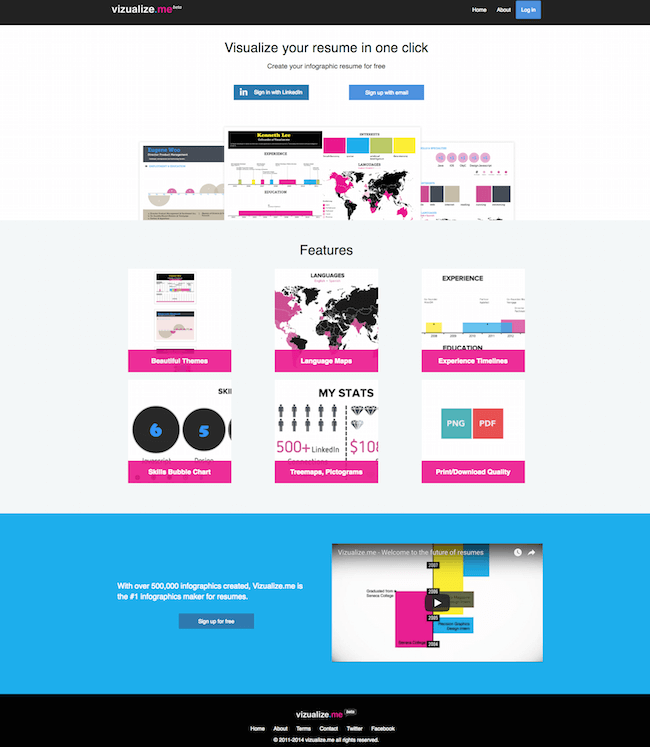
12. Vizualize.me
If you are looking for a tool t create an infographic resume, vizualize.me is the perfect tool for you. It has an amazing user-friendly interface which is made even easier when you connect it to your LinkedIn profile.
This makes it automatically generate some of your LinkedIn information in your design.
13. Easel.ly
Another easy-to-use Infographic creating site, Easel.ly makes the process super simple for the users.
If you are a complete newbie and don’t have much experience in creating visual content, this site will not disappoint you.
Go to the site, pick any of the available templates, and get started, it is that simple. If you are using this site as a free user, you still get access to the ready-to-be-use templates.
If you become a pro member, you will get access to over 500 ready to be used as templates to choose from.
Overall, a nice site to create your infographics.
14. Google Chart
Google Chart gives you an easy option to create amazing graphs and charts for your site that you can easily use on your site.
It’s a free service from Google, so you can create amazing graphs for your content and use them.
When you display charts and graphs in your article, the post becomes more interesting and engaging.
Also, if you can create good quality graphs for any important topic, other people will use it on their site and link back to your site sending you some extra traffic.
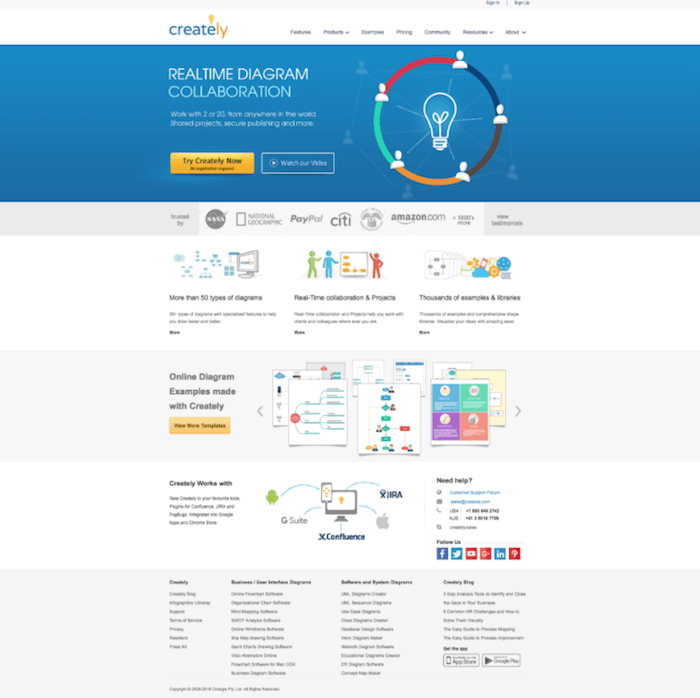
15. Creately
Another very useful tool that helps you to create amazing diagrams for your project. Use this tool to create some different diagrams quickly and easily.
This tool is not only for online entrepreneurs but a complete project solution for students as well as corporates.
You can create over 50 different types of diagrams for your project using this tool. Another great feature is the option to collaborate with your clients and colleagues.
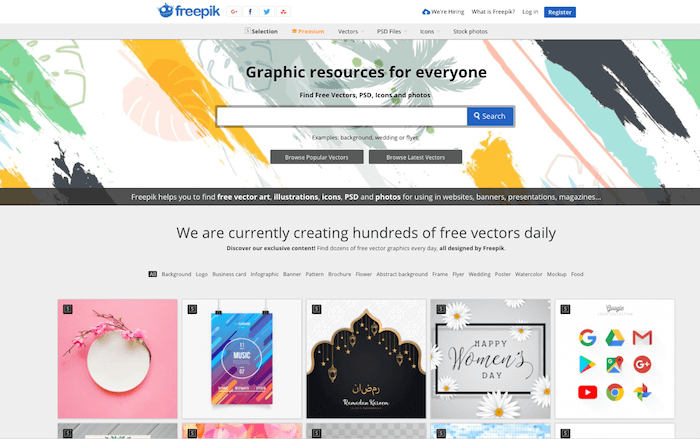
16. Freepik
Freepik is not a tool to create an infographic, but a site where you can find amazing images, free vectors, and illustrations that you can use on your infographic.
This site offers you a huge collection of images that you can use for free with proper attribution, so check the image license before using it.
17. Adioma
Adioma is another amazing tool to create infographics. This site comes with a range of different ready-to-be-used templates. You will get ready to use icons and a large collection of infographic templates that you can use to create your design.
The intuitive interface makes it simple for the users to create a beautiful design. Another useful feature is that you can smoothly switch the template of your infographic so that you can use the same infographic on different templates making it easy to use and share on all different social media platforms.
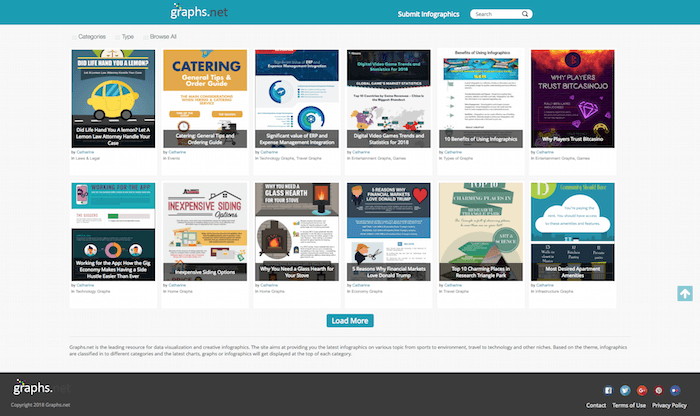
18. Graphs.Net
This site is a great source of infographics, the site allows users to submit their infographics and others can use it for free.
The site created multiple categories from legal to tech where users can quickly submit the amazing infographic design they have created to increase the number of eyeballs.
If you are looking for a quality infographic for a certain niche, this is a great source to find one.
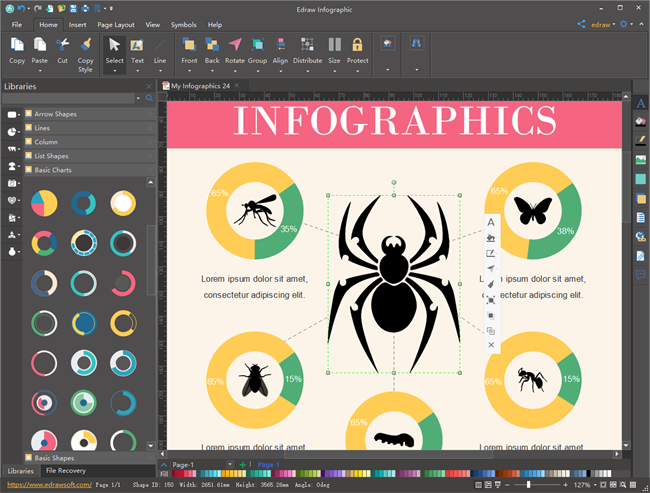
19. Edraw
If you need an offline tool to create infographics, here is the one for you. You can create a completely modern and attractive infographic with this amazing software.
The system doesn’t take time like the online tools to load images and symbols. It is a feature-rich tool that offers you some amazing design elements that will surely help you to create a stunning design.
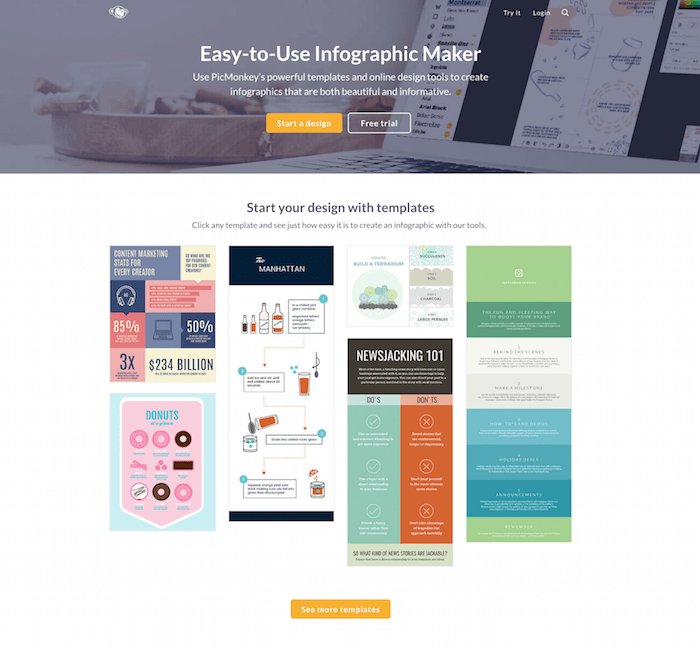
20. PicMonkey
PicMonkey is another popular image editing tool that offers you custom options to create great-looking infographics for your project.
Other than Infographics, these tools offer you the option to create many other important designs such as the logo maker, wedding invitations, business card makers, etc.
Like many other leading tools, the MicMonkey also offers you the option to pick a template and start creating your professional infographics instantly.
Their back plan starts at $5. However, you have the option to go for their free trial option so that you can be sure that this tool is good enough for you.
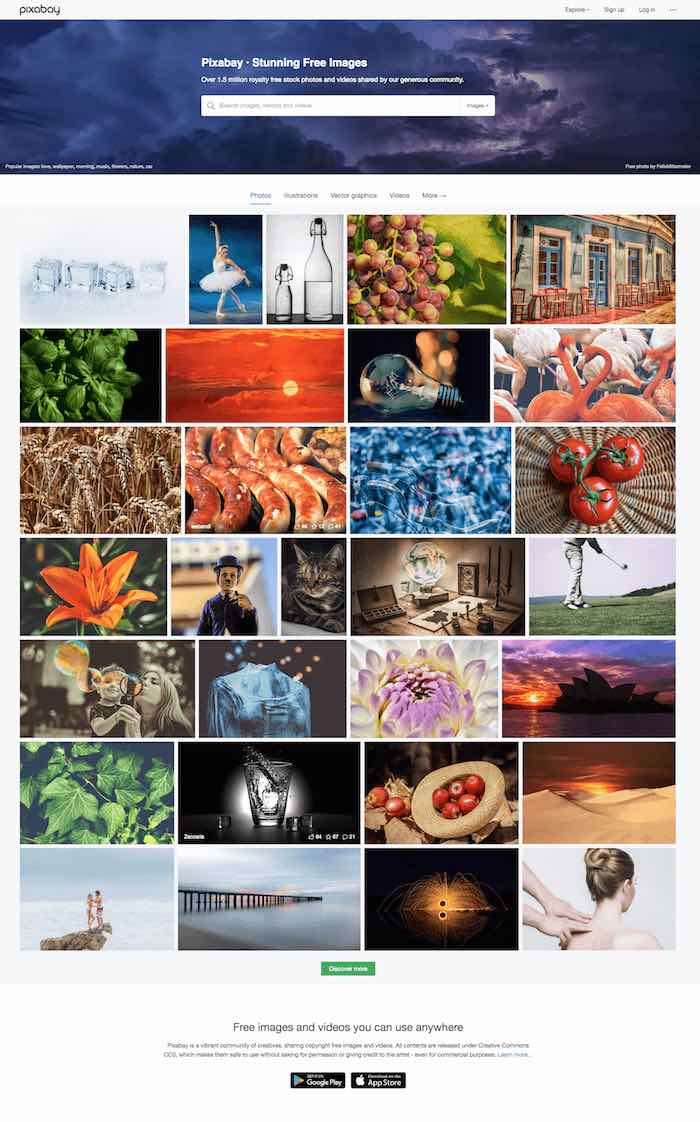
21. Pixabay
Most of the biggest and most widely used free stock picture platforms, Pixabay brings in a huge collection of images from hundreds of different categories.
The site is quick and easy to use, just find images with the keywords of your choice and select the best image that you can use for your Infographic.
Do check the licensee type, you can use all their images for free but you might have to give credit to the original designer.
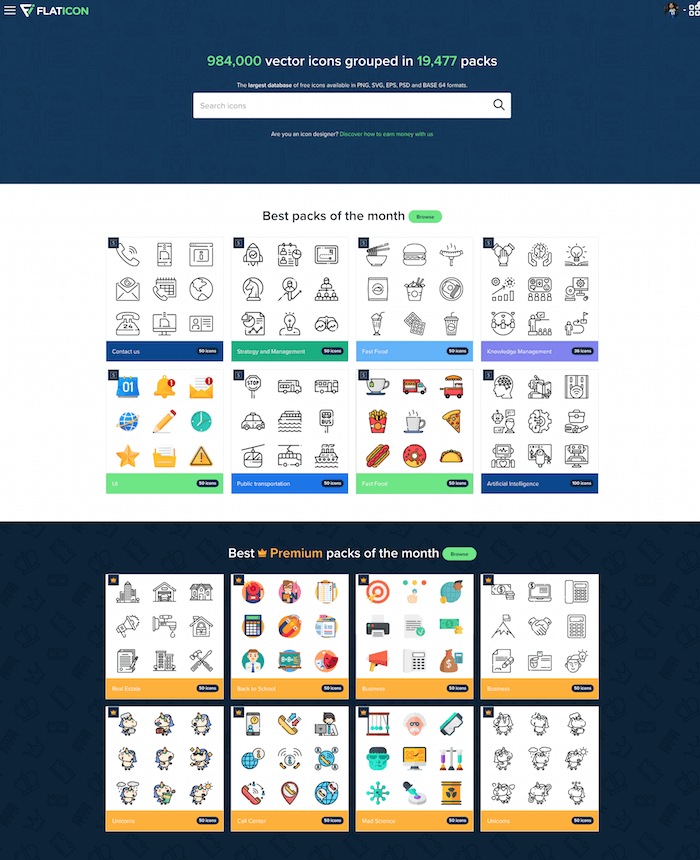
22. Flaticon
Icons are one of the most important ingredients of any professionally designed Infographic and need to use top-quality icons if you wish to make your design stand out.
The Flaticon site has a huge collection of icons from almost all categories that you can think of. The best part about the Flaticon collection is the quick icon editor option.
You can select the icon that you wish to download and edit it with your own color option to match it with your branding.
You also have a number of different file type options to download the icon and the size option. So, overall this is the best source to find the cions for your Infographic design.
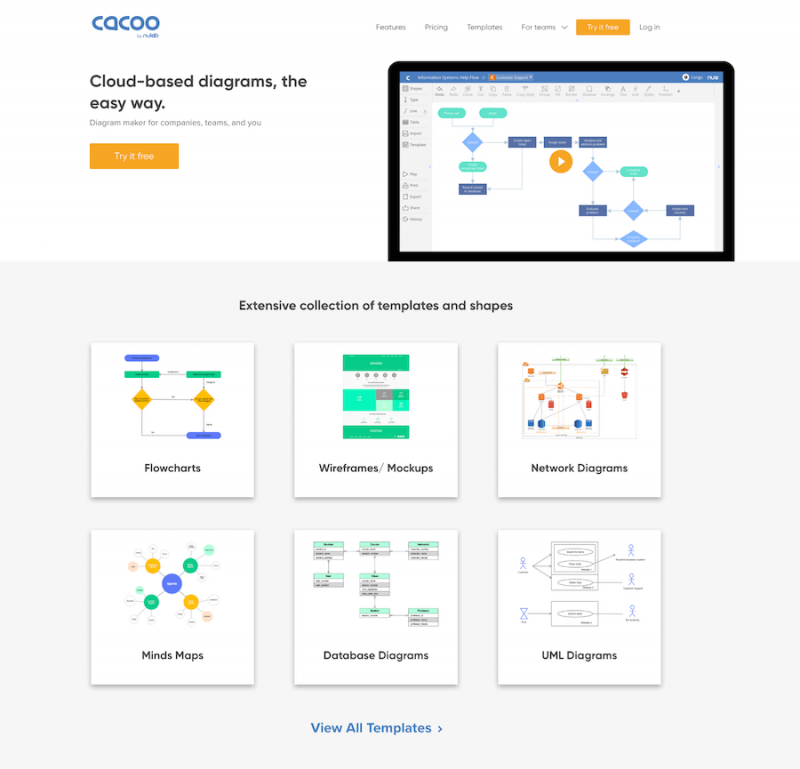
23. Cacoo
If you are looking for different shapes and templates for your infographic design, Cacoo is a great option for you.
It is a cloud-based service that offers you a number of ready shapes, network diagrams, flowcharts that you can use to create your document.
Cacoo gives you the option to work together on a document with your team which makes it a very useful tool for organizations of any size.
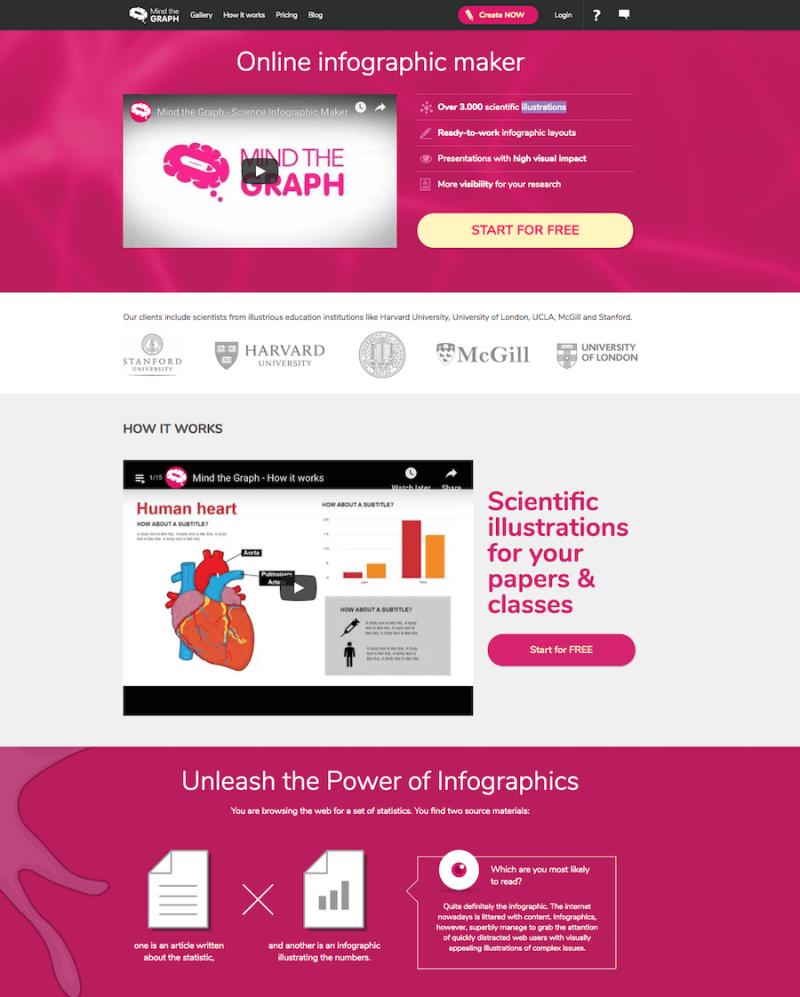
24. Mind the Graph
Mind the Graph is an Infographic maker that you can use to create beautiful infographic designs. If you are into any kind of science project where you need to present your documents, these tools are custom-created for you.
You can use this tool to create diagrams and designs to complement your papers. This tool offers you over 3000 ready scientific illustrations and ready infographic templates to expedite your process.
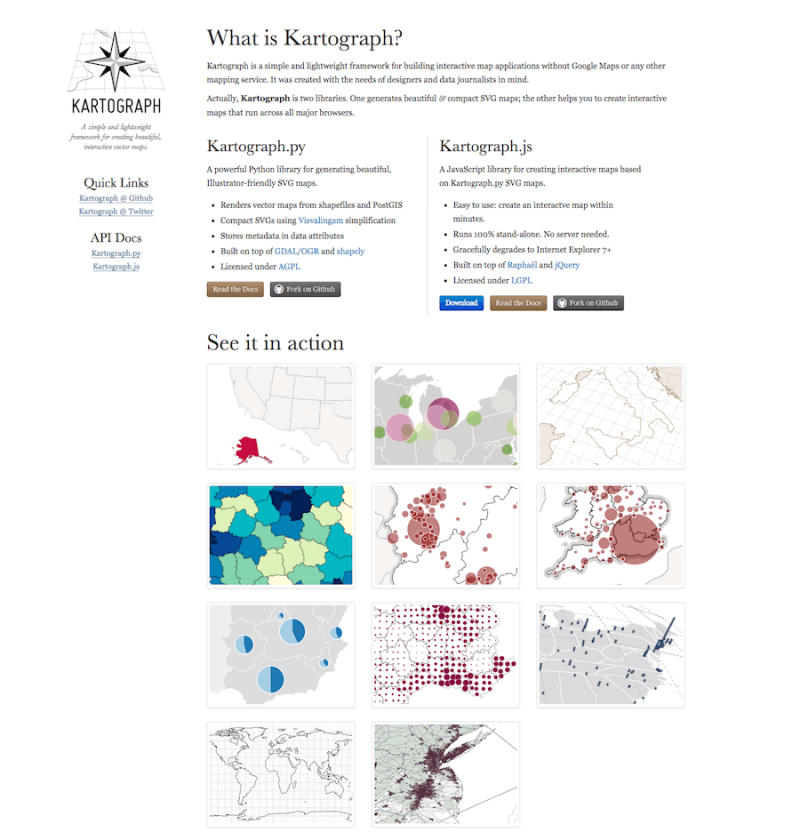
25. Kartograph
If you need maps for your infographic, this is one of the best tools for you. Kartograph gives you the option to create great-looking interactive maps that you can use in your design.
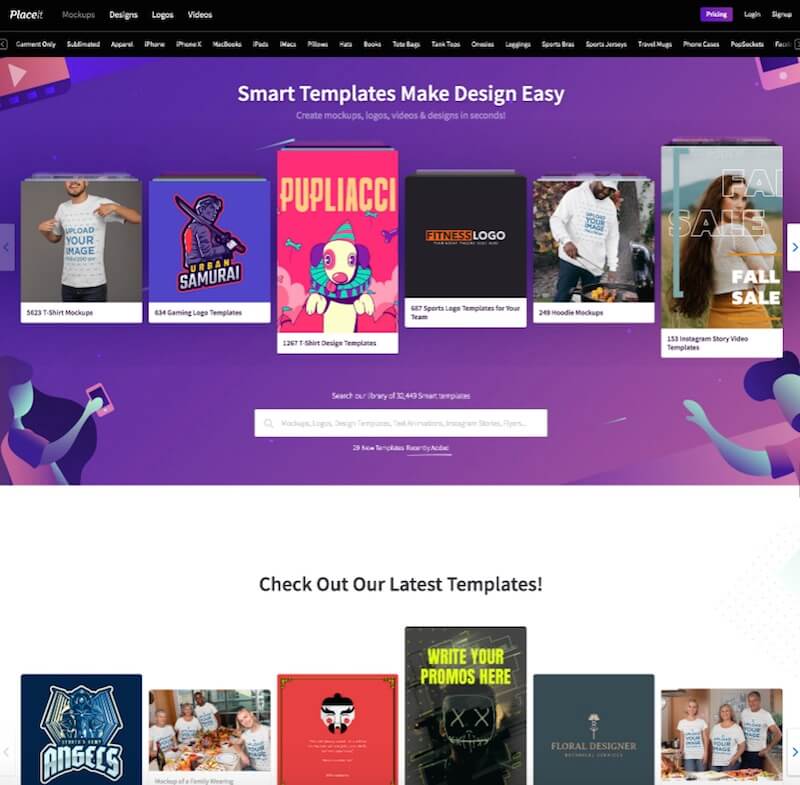
26. Placeit
Placeit from Envato is another great resource to find a big collection of designing elements that you can use on your infographics.
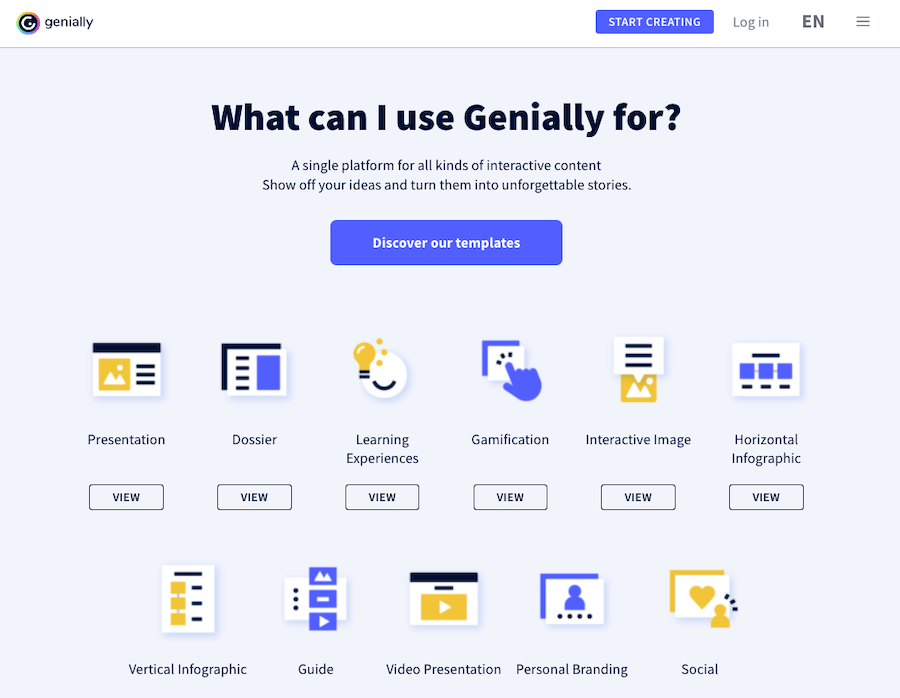
27. Genially
Genially is an all-in-one designing platform that you can use to design presentations, guides, video presentations, horizontal infographics, Vertical infographics, and more.
You have all the features and options that you need to create a modern interactive design that can explain your course or any blog post in the most engaging way. If you are looking for the best infographic platforms, Genially is certainly one of them.
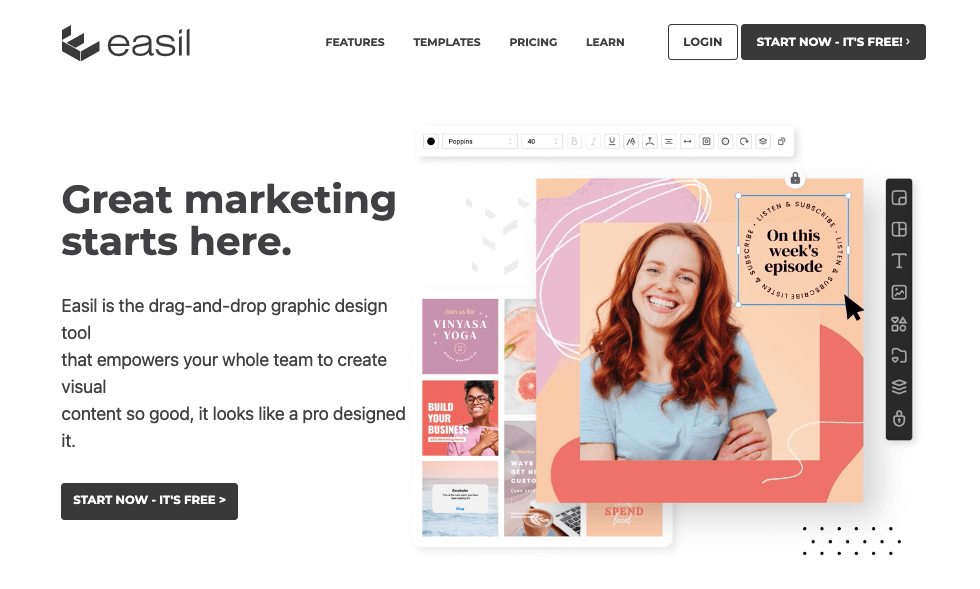
28. Easil
Easil is a popular software to create graphics that can be used for marketing materials, social media posts, and more. Easil has a wide variety of templates and tools that make it easy to create professional-looking designs.
It comes with darg ad drop graphic creating interface to make it easier for users to design high-quality graphics without any prior knowledge.
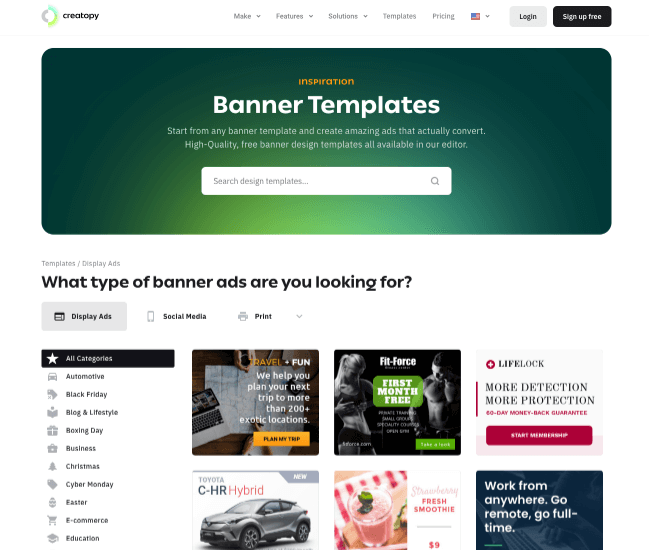
29. Creatopy
Creatopy is a cloud-based graphic design platform that helps businesses create high-quality images and graphics for marketing and branding needs. With Creatopy, businesses can easily create professional designs without the need for expensive software or design expertise.
Some of the features that make Creatopy stand out include its built-in templates, drag-and-drop interface, and wide range of tools and resources. Creatopy also offers a free plan with limited features.
While it is not a custom infographic design platform, you can use Creatopy to create the images and elements that you can use on your infographics.
Conclusion
So now that you know why to use infographics and how to create them, I am sure you will take out some time from your busy schedule to come up with some amazing ones.
And once you are done doing it, do leave a link to your site in the comment section below. Let me and my readers have a look at your beautiful creation.
Until then keep visiting us for more amazing content.